
Your dashboard should not own the engineer.
Divya Koppikar, Product and UI/UX Designer, Nirixense Technologies
Om Narayan Singh, Applications Engineer, Nirixense Technologies
(September 2026)
A monitoring platform should make engineering easier, not make the engineer dependent on the platform.
There is an understandable temptation in engineering software to make the dashboard the centre of everything.
The sensor data comes in, the platform processes it, the charts appear, the alerts are generated, the report is produced, and the engineer is expected to do most of their work within the same interface.
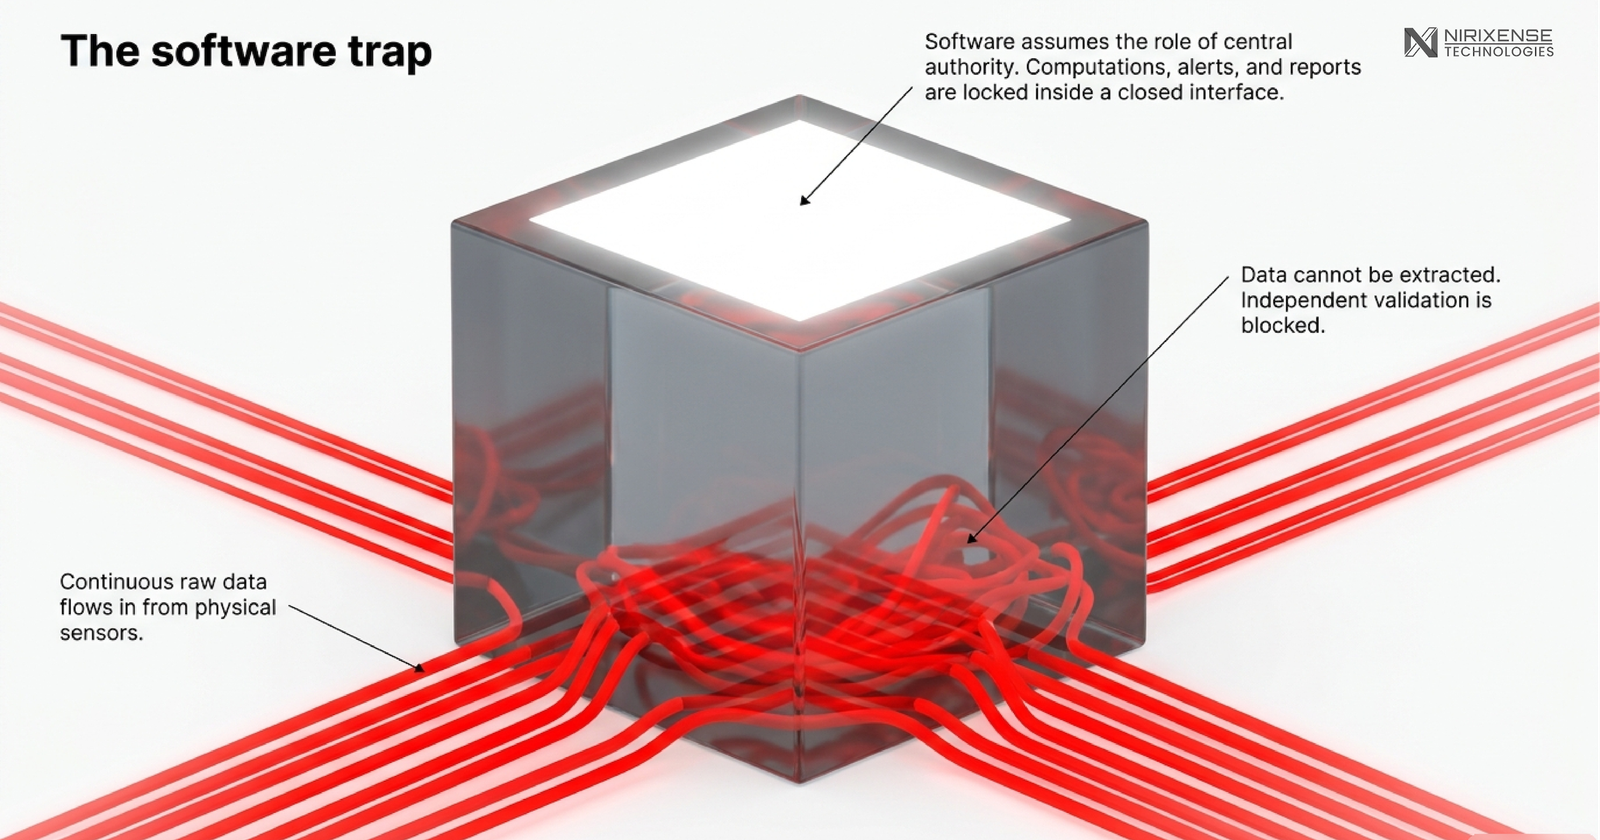
From a product perspective, this feels like completeness. From an engineering perspective, it can become a limitation.
Because there will always be a moment when an engineer wants to ask a question that the dashboard was not designed to answer.
They may want the raw time series rather than the processed graph. They may want to apply a different filter. They may want to compare two sensors in a way the interface does not support. A researcher may want to run the dataset through their own model. A consultant may want to validate the platform’s interpretation independently.
At that point, the quality of a monitoring platform is no longer determined by what it shows.
It is determined by what it allows the engineer to access beyond what it shows.
The dashboard is an interpretation layer
This distinction is particularly important in Structural Health Monitoring.
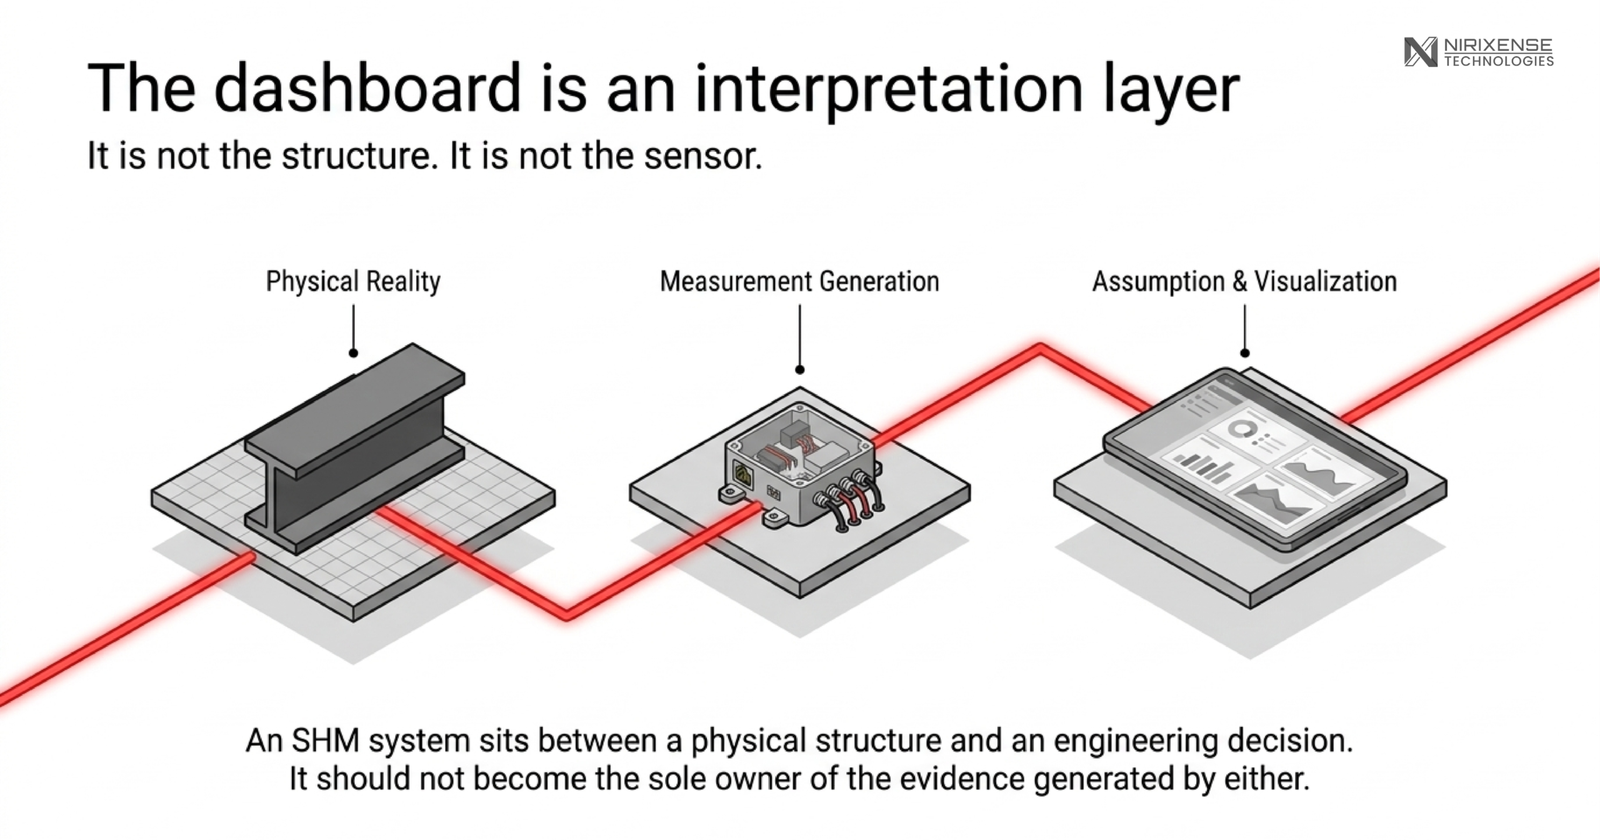
An SHM system sits between a physical structure and an engineering decision. Sensors produce measurements; software organises and visualises them; engineers interpret those measurements in the context of the structure.
The dashboard is therefore an interpretation layer.
It is not the structure.
It is not the sensor.
And it should not become the sole owner of the evidence generated by either.
In a conversation with a professional who has worked across structural engineering software, structural codes and vibration monitoring, described this distinction through the practical needs of different users. There are users who need a high-level understanding of structural performance: Is the structure behaving normally? Are there concerns? Are there events that require attention?
Then there are technical users, researchers, engineers and students, who may need to go considerably deeper into the same dataset.
For them, the ability to access the underlying data is not a premium feature. It is part of the engineering workflow.
Consider a permanent monitoring installation.
An asset owner may need a simple summary of structural behaviour.
A project manager may need to know whether an alert occurred and when.
A structural engineer may want to examine the response around that event.
A researcher may want the complete time series, sensor metadata and sampling information so they can perform their own analysis. These are not four versions of the same user, they are four different relationships with the same evidence.
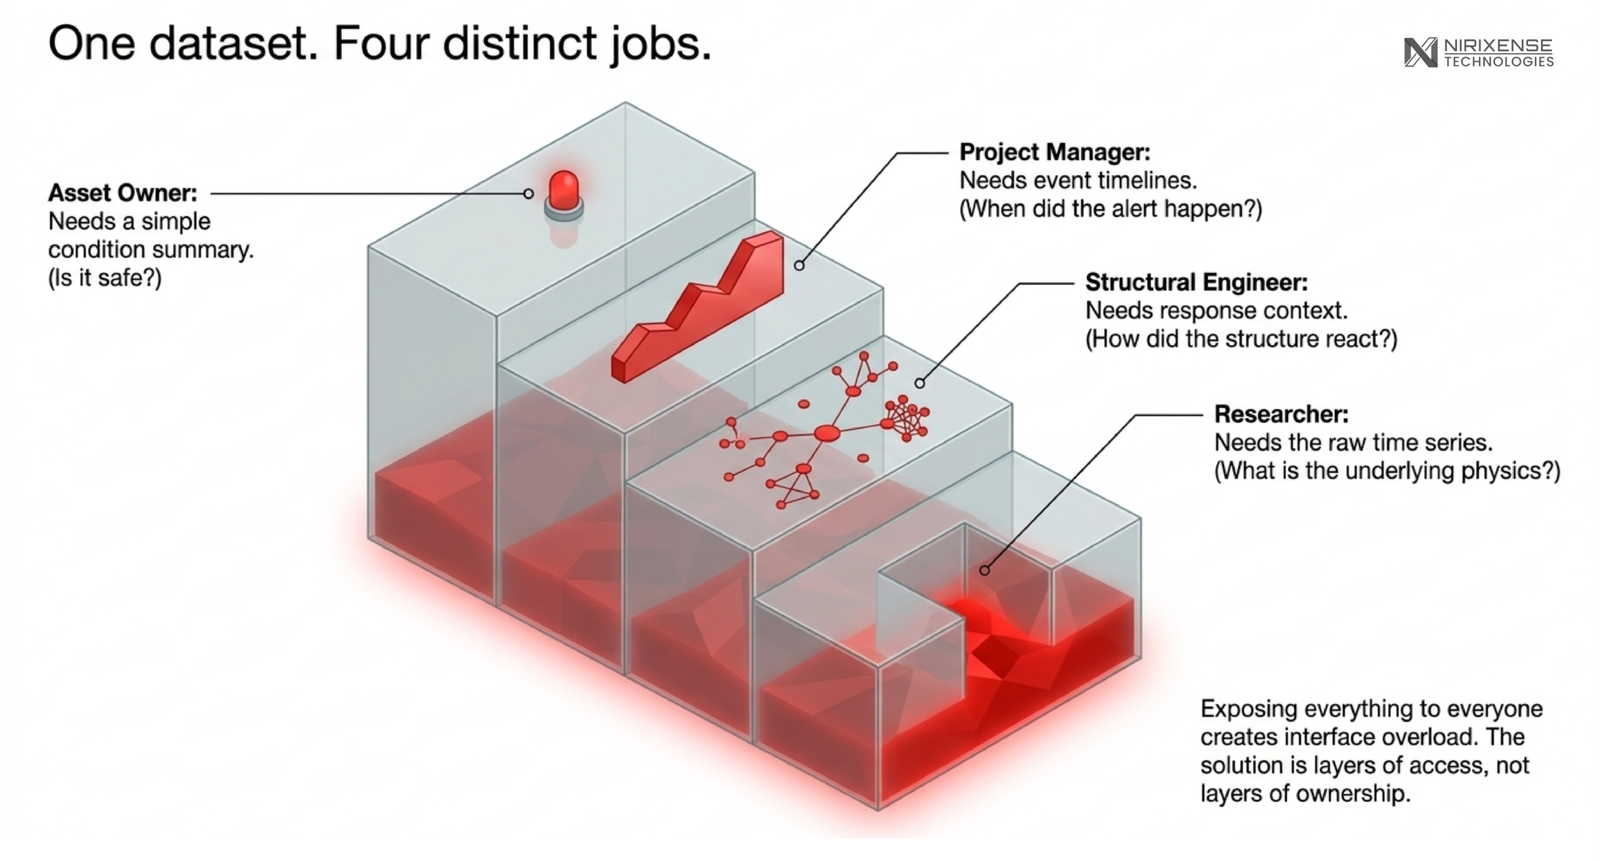
Trying to satisfy all of them with one increasingly complicated dashboard creates a familiar problem: the interface becomes overloaded for the people who need simplicity, while still being insufficient for the people who need depth.
The better approach is not necessarily to expose everything to everyone.
It is to create layers of access without creating layers of ownership.
The executive view can remain simple.
The engineering view can become deeper.
And the underlying dataset should remain accessible when someone needs to go beyond either.
This principle aligns with broader thinking around research data management. NIST’s Research Data Framework, for example, treats accessibility, interoperability, reuse and provenance as important properties of research data rather than treating a visual interface as the endpoint of the data lifecycle.
There is sometimes a product assumption that raw data is something the platform should hide because it is too complicated for most users.
That is true for some users. It is not true for engineering itself.
A processed signal is an interpretation of a measurement. A filtered graph is an interpretation of a signal. An alert is an interpretation of a condition.
Each layer is useful. But each layer also introduces assumptions.
What filter was applied? What sampling rate was used? Was a sensor unavailable during part of the event? Was the value interpolated? Was the signal transformed before the graph was generated? What was the baseline? Which sensor produced the measurement? What happened immediately before and after the highlighted event?
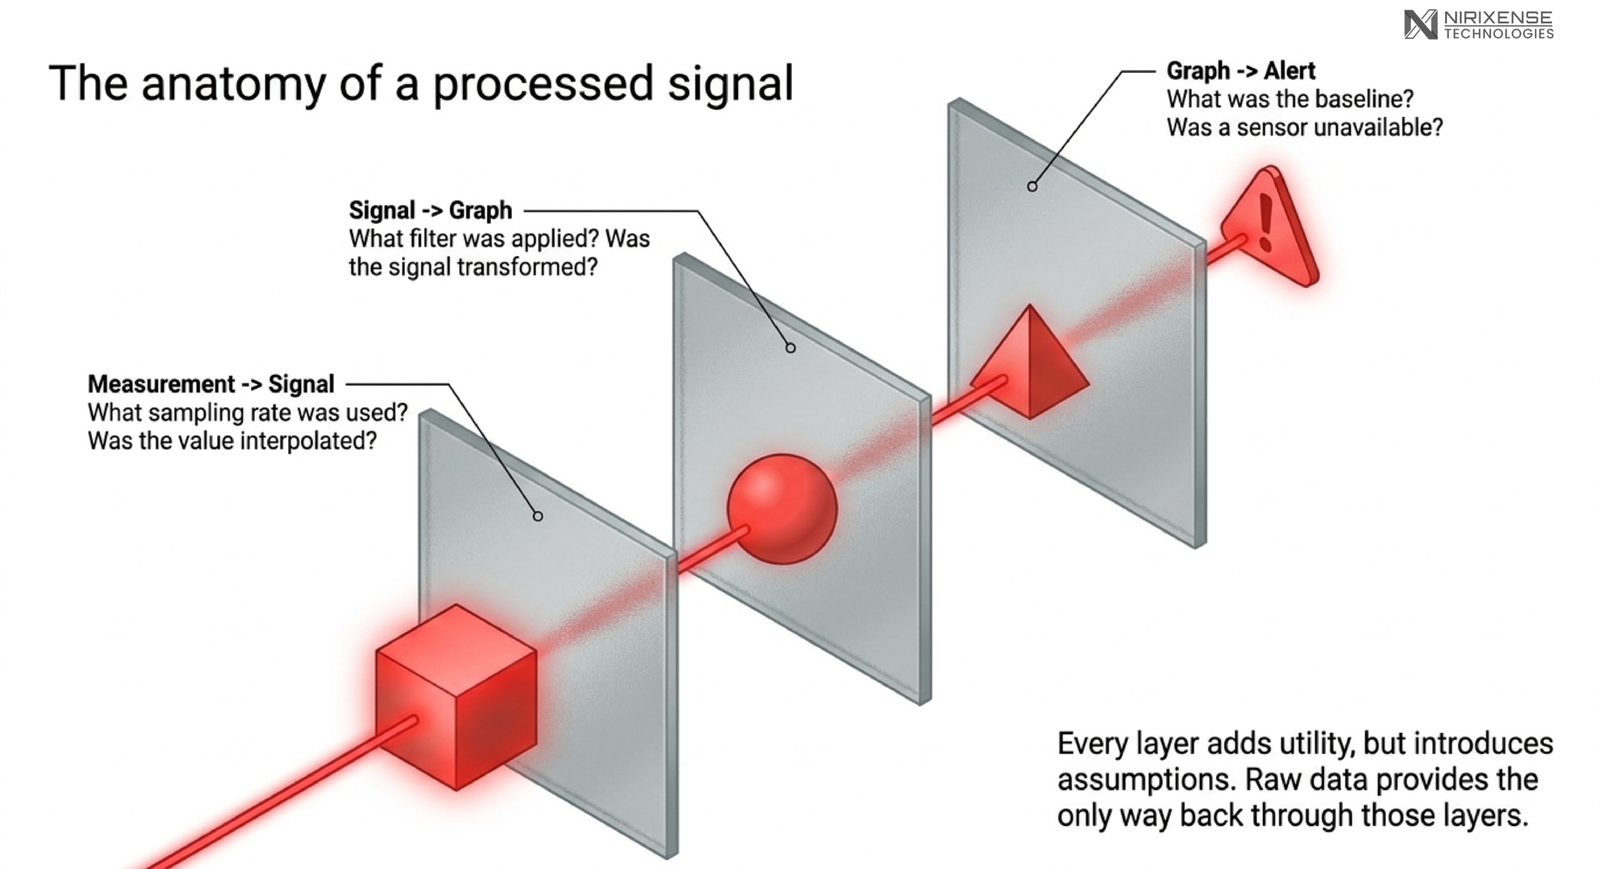
These questions become particularly important when the result influences an engineering investigation.
The raw dataset provides a way back through those layers. It gives the engineer something to interrogate rather than simply something to accept.
This is why the ability to export and independently analyse data should not be treated as a failure of the dashboard.
It is evidence that the dashboard has done its job without becoming a dependency.
The experience shared in our conversation about earlier monitoring systems offers an interesting contrast to today’s cloud-first interfaces. A decade ago, continuous monitoring itself created practical problems that are easy to overlook now.
Storage was limited. Connectivity was unreliable. Large volumes of multi-sensor data could quickly become difficult to manage. Monitoring computers sometimes had to remain offline because changes in browsers or security environments could affect the stability of the monitoring setup.
The engineering workflow therefore had to account for the infrastructure beneath the dashboard.
Data could not simply be assumed to exist somewhere in the cloud forever. That history matters because today’s problem has changed, but the underlying principle has not.
We have become much better at storing and displaying data.
The question now is whether engineers have enough control over that data once it enters the platform.
A more sophisticated interface does not automatically mean a more open system.
In fact, the opposite can happen. The better the interface becomes at hiding complexity, the easier it is to forget that the complexity still exists underneath.
There is an important distinction between accessibility and unrestricted access.
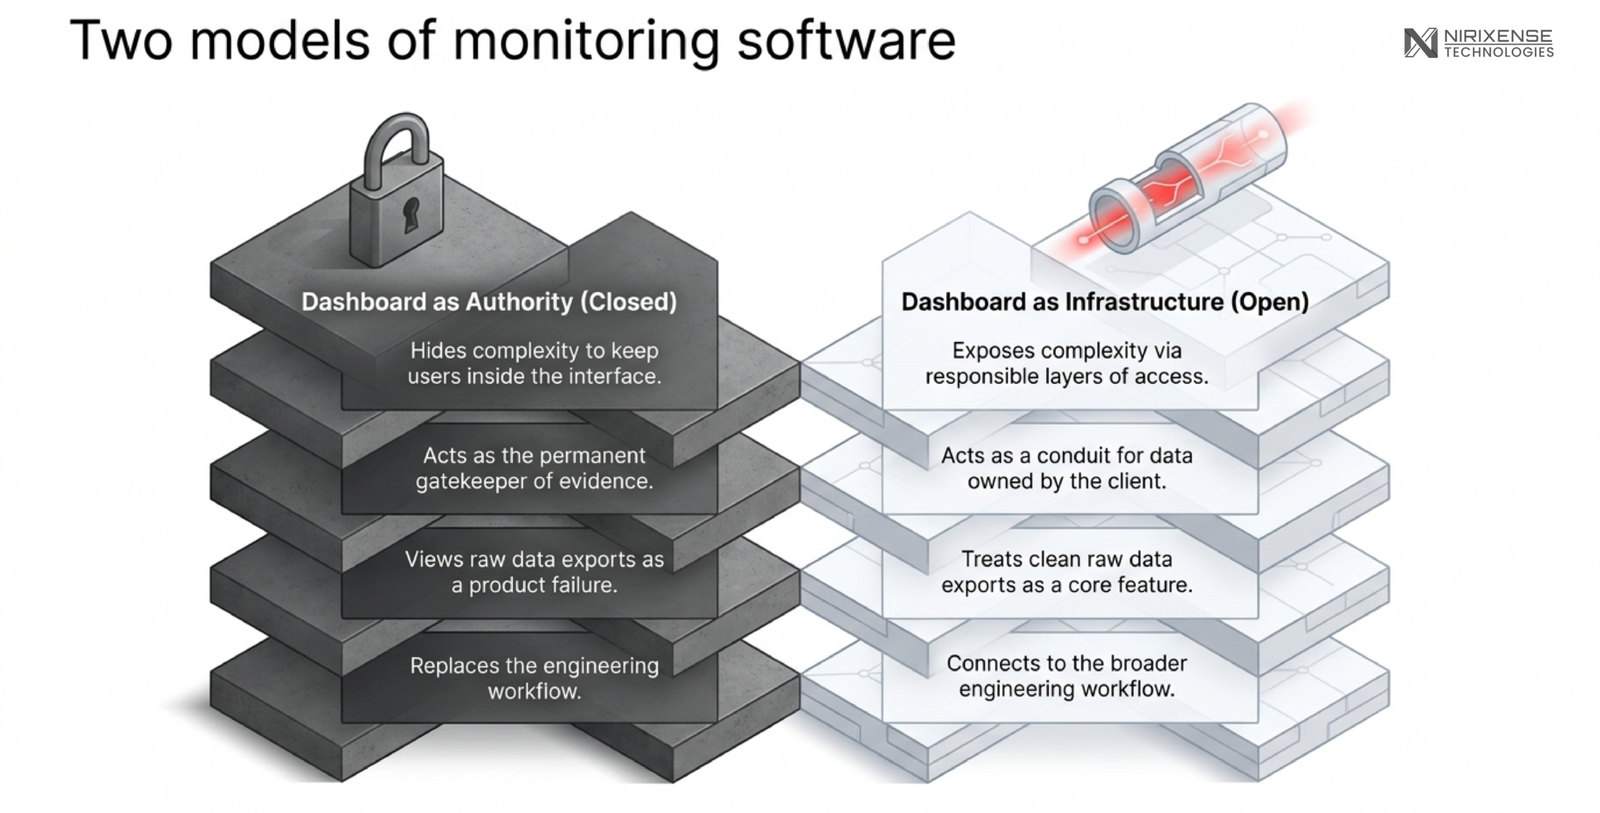
A monitoring platform can have strict permissions while still giving authorised engineers access to raw measurements. It can maintain audit trails while allowing data exports and preserve provenance while supporting external analysis. It can separate administrative users from technical users without locking technical users into the platform.
This is where data ownership becomes important.
The principle was put simply: “Data must be owned by the client.”
That changes the relationship between a monitoring platform and its customer. The platform becomes the infrastructure through which the data is collected, organised, interpreted and acted upon.
It does not become the permanent gatekeeper of that data.
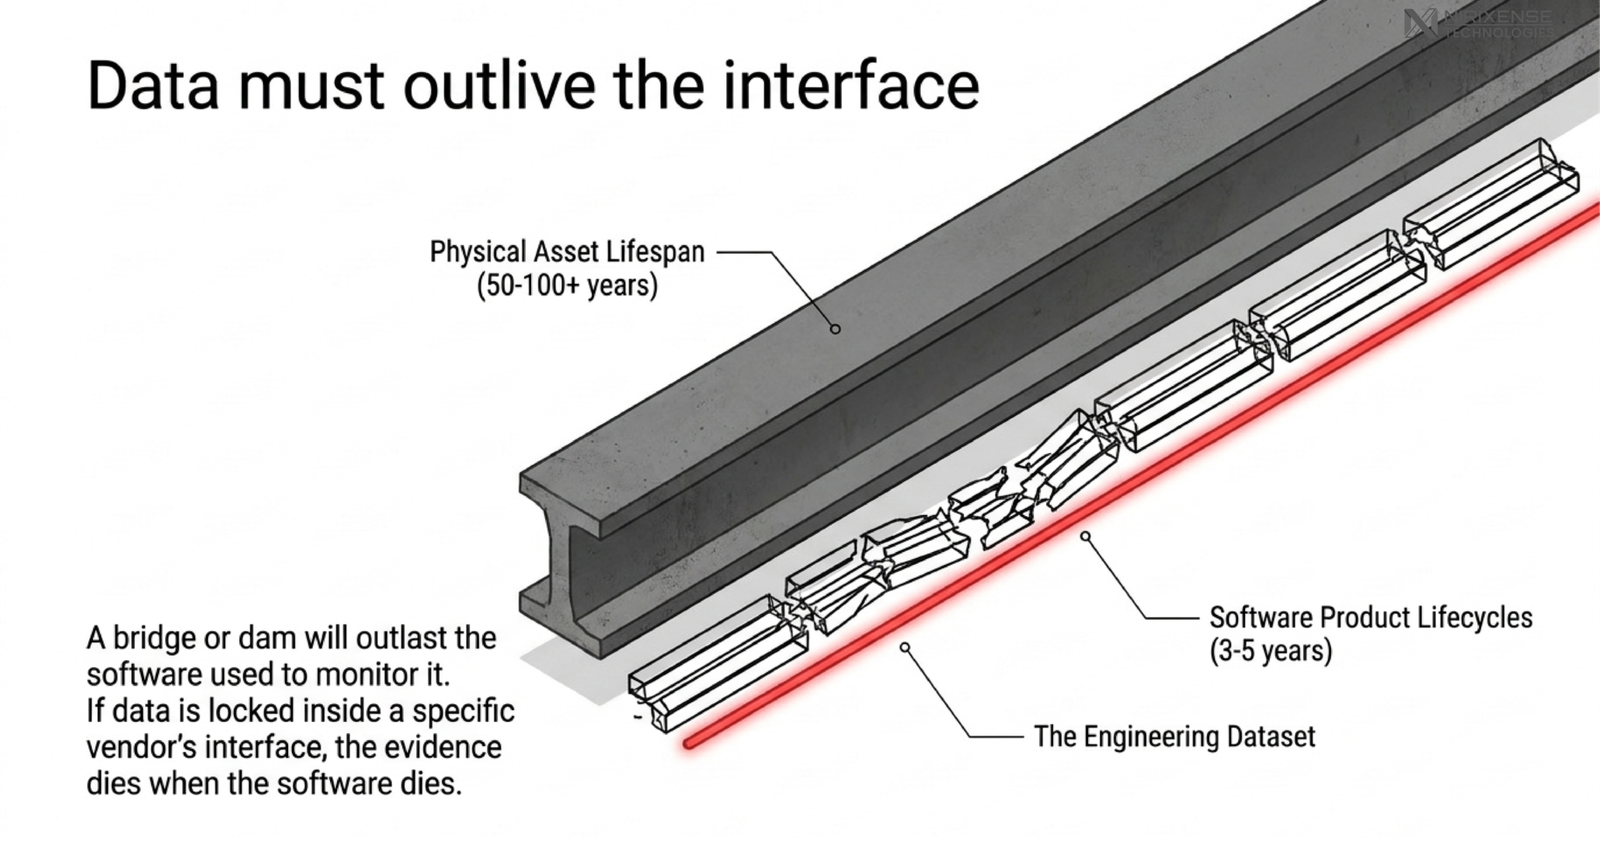
This matters beyond customer trust. It matters for long-duration infrastructure monitoring, where the useful life of the structure can extend far beyond the useful life of any particular software product.
A bridge, building, dam or industrial asset may be monitored for years.
The engineering tools used to analyse that data may change several times during that period. The dataset should therefore be able to outlive the interface.
The broader engineering workflow already reflects this reality.
Standards, design models, inspection records, sensor measurements, calculations, reports and field observations rarely live in one place.
They form an evidence chain, SHM is one part of that chain.
The American Society of Civil Engineers’s Structural Health Monitoring & Control Committee, for example, explicitly encompasses areas including damage detection, fault isolation, sensor networks and system identification, while also maintaining resources around experimental data and software sharing.
Similarly, the Institution of Structural Engineers describes SHM in terms of sensing, data acquisition, post-processing and interpretation, reinforcing that monitoring is part of a broader engineering process rather than simply a dashboard experience.
The implication is straightforward: A monitoring platform should connect to the engineering workflow, not attempt to replace the workflow.
This becomes even more important as engineering moves toward digital twins and connected asset information.
A future structural model may contain design information, inspection history, sensor locations, live measurements, analysis results and maintenance records.
For that to work, information cannot remain trapped inside isolated interfaces.
NIST’s work on engineering information integration similarly emphasises the need to connect information across lifecycle stages, while its work on building digitisation highlights the role of interoperable, machine-readable information in connecting heterogeneous building data.
That makes interoperability more than a technical architecture decision.
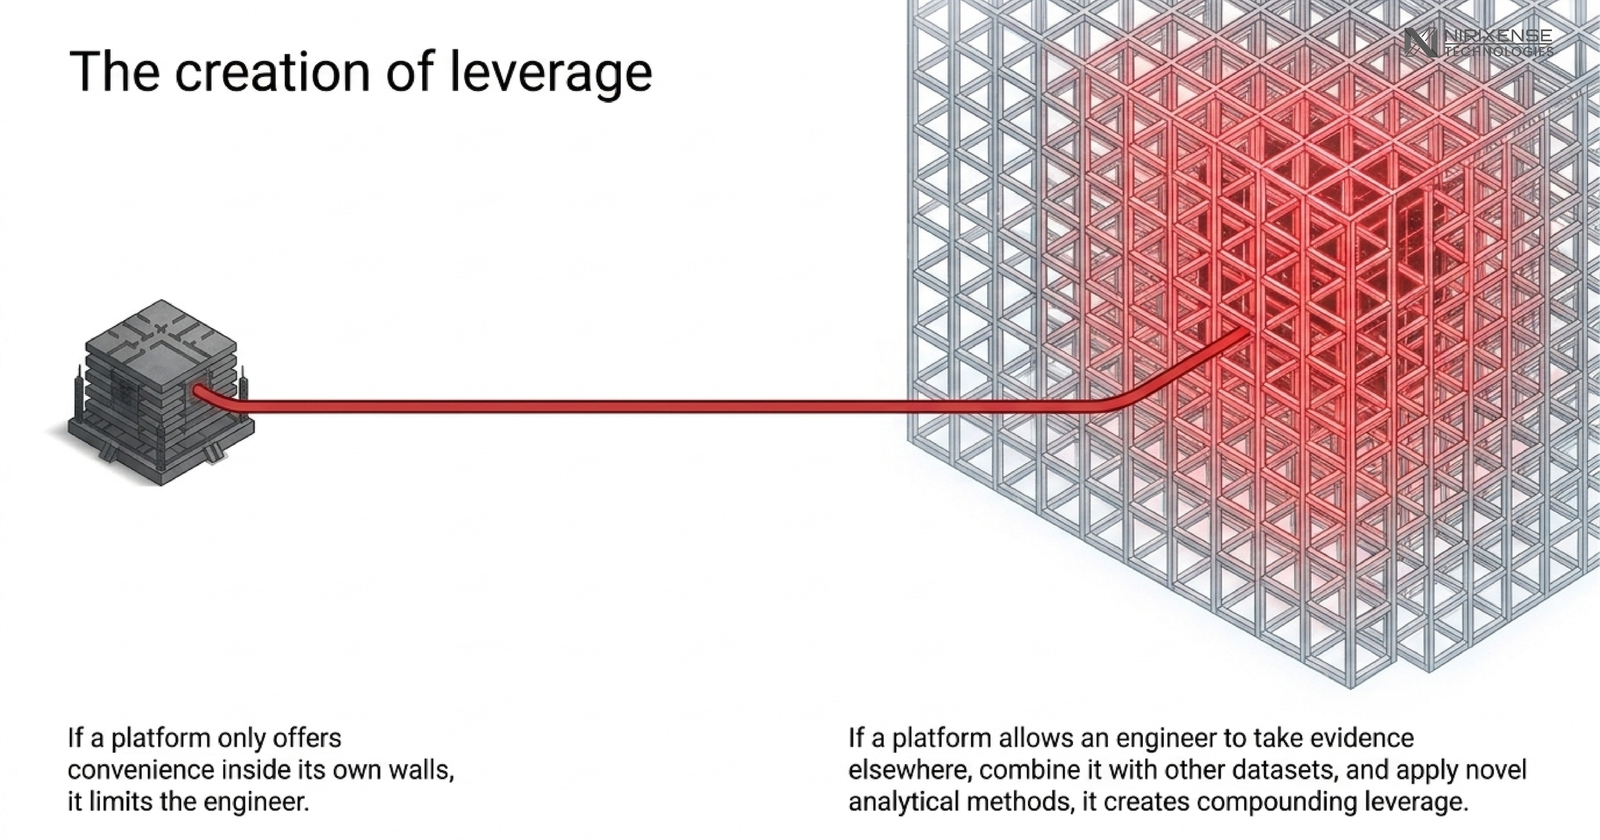
It becomes a product principle. If an engineer can only understand an asset by using one vendor’s interface, then the system has created convenience but not necessarily an open engineering environment.
If the same engineer can take the evidence elsewhere, combine it with another dataset, apply another analytical method and return with a better understanding, the platform has created something much more valuable.
It has created leverage.
The dashboard should know what it is good at
This does not mean dashboards should become minimalist data viewers. Quite the opposite. A good monitoring platform should take responsibility for the difficult organisational work between the physical structure and the person trying to understand it. It should bring together measurements from distributed sensors, maintain their asset and sensor context, and make relevant time periods, events and changes in behaviour easy to locate without requiring engineers to reconstruct the dataset manually.
The platform should provide useful visualisations, preserve the metadata and provenance needed to understand the measurements, and reduce the time engineers spend searching, sorting and organising information. But it must also recognise the boundary between helping someone interpret evidence and becoming the only place where that evidence can be interpreted.
That distinction matters because engineering software should not be designed to maximise interaction with the software itself. Its purpose is to remove unnecessary work so engineers can spend more time understanding the structure, evaluating evidence and making informed engineering judgements.
A useful test for monitoring platforms
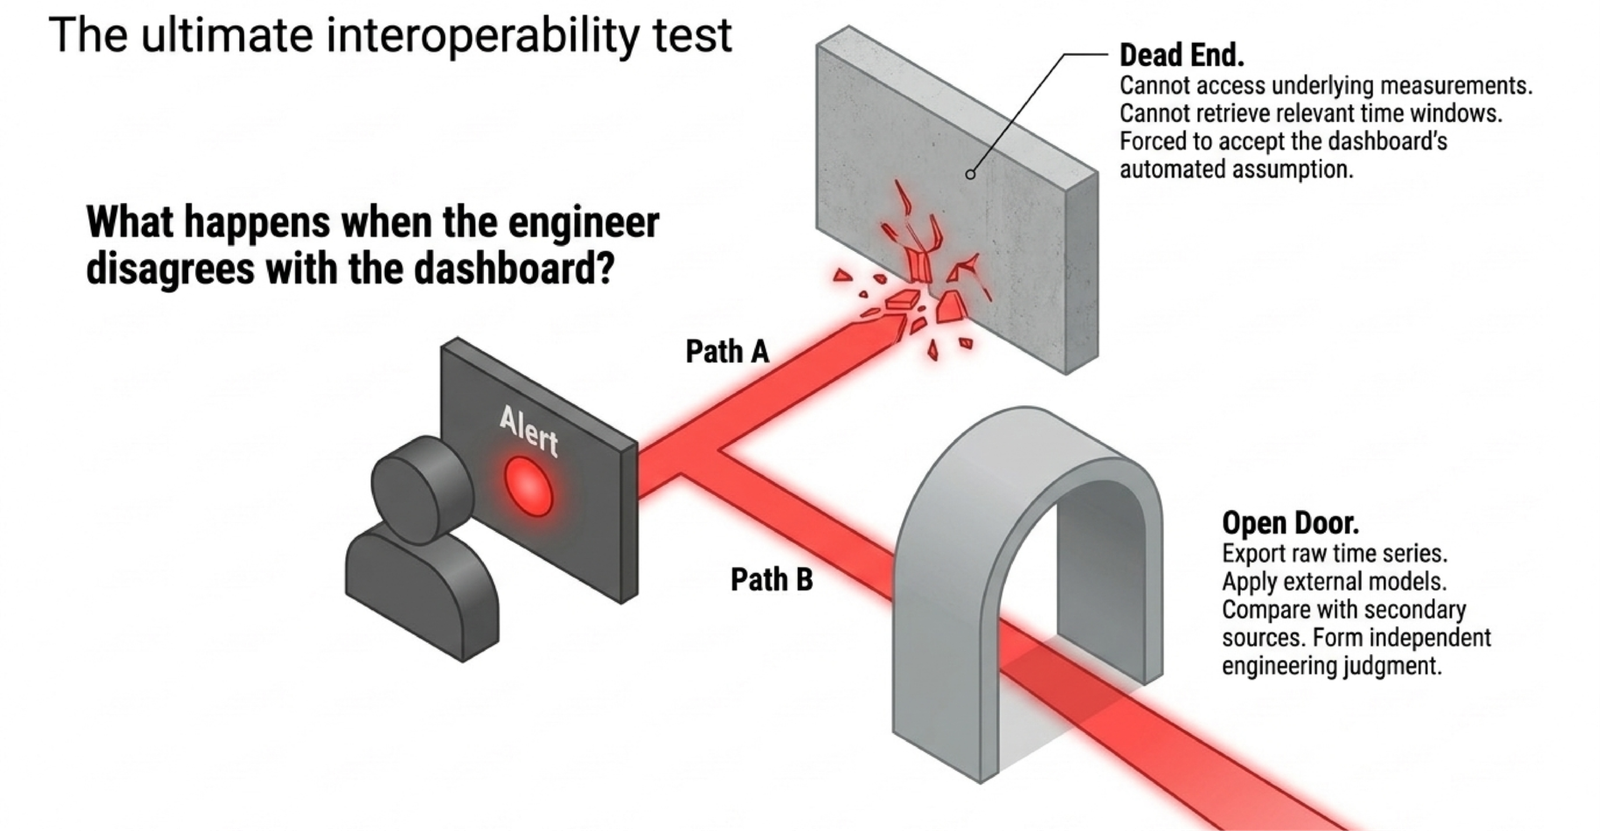
There is a simple question that can reveal whether a monitoring platform has crossed that boundary: what happens when the engineer disagrees with the dashboard?
Can they inspect the underlying measurement, retrieve the relevant time window and understand how the displayed value was derived? Can they access the context of the sensor that produced it, export the data, apply their own analysis and compare the result with another model or source?
Ultimately, can they arrive at an independent engineering judgement?
If the answer is yes, the platform is functioning as engineering infrastructure. It is helping the engineer organise and understand evidence while leaving them in control of how that evidence is interpreted.
If the answer is no, the platform has started functioning as an authority. The engineer is no longer simply using the system to access evidence; they are becoming dependent on its interpretation of that evidence.
A dashboard can assist a decision, but it should not quietly become the decision-maker simply because the engineer cannot see beyond what it presents.
Designing for independence
Once this principle is taken seriously, several product decisions become more important.
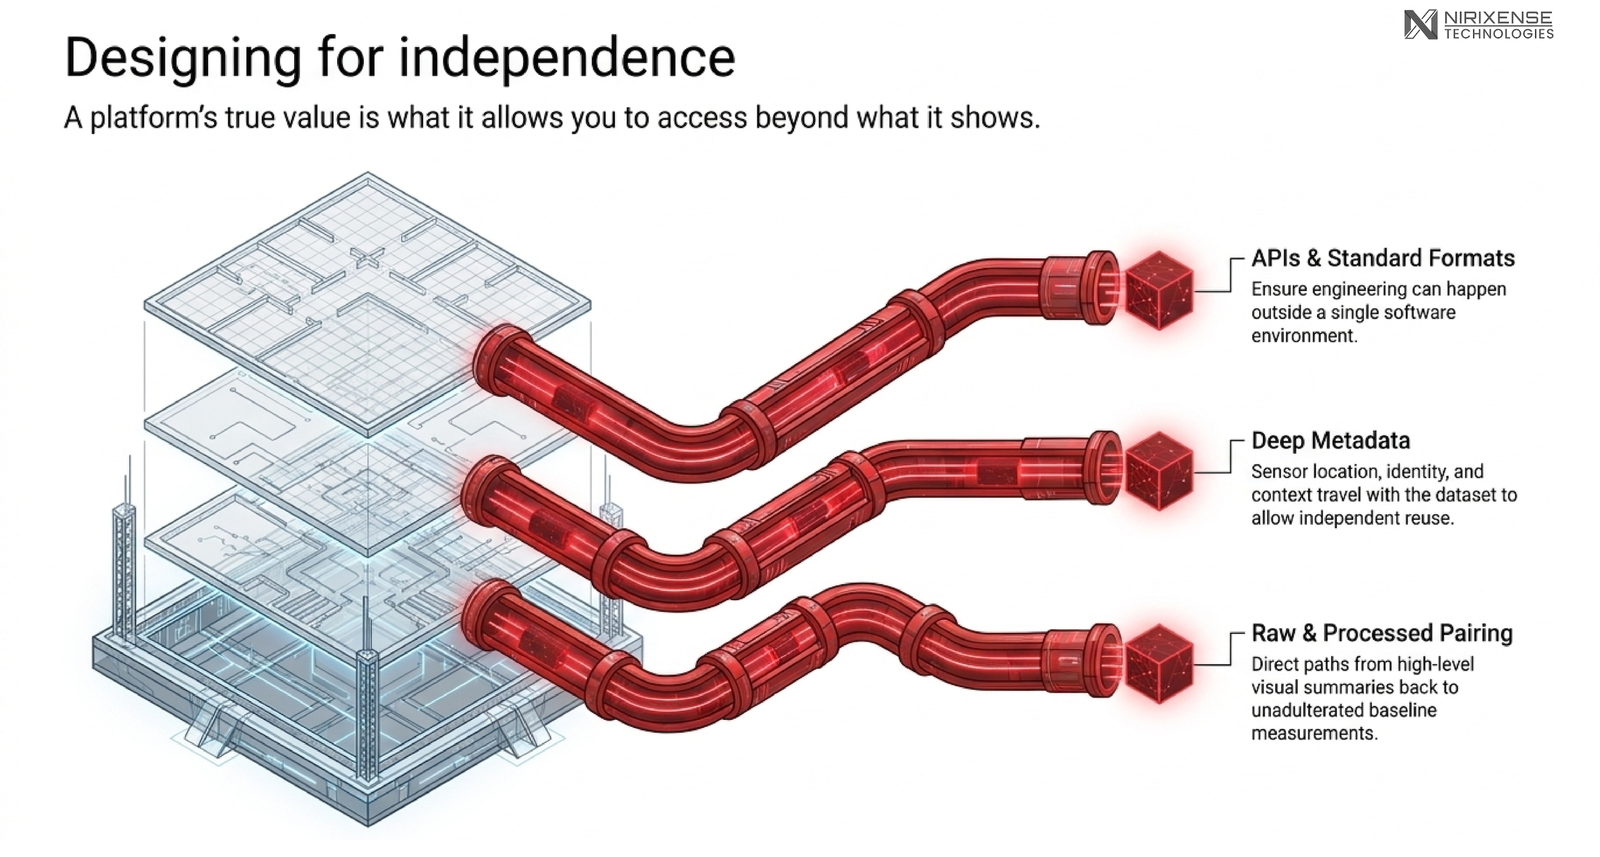
Data export becomes part of the core engineering workflow rather than an afterthought, allowing measurements to remain useful when a different analytical method or tool is required. Raw and processed data should be treated as complementary layers: processed information makes the system easier to understand, while raw measurements provide the depth needed for verification and independent investigation.
Metadata is equally important because a measurement without its context has limited value. Engineers may need to know which sensor produced it, where that sensor was located, what parameter was measured and how the measurement relates to the asset.
For the same reason, sensor location and identity should be treated as part of the engineering dataset rather than simply dashboard information. Permissions should enable responsible access without turning access control into a mechanism for restricting ownership.
Finally, APIs and standard data formats matter because engineering rarely happens within a single software environment. Monitoring data may need to be combined with inspection records, structural models, calculations or other analytical tools.
Most importantly, product teams need to resist the instinct to answer every engineering question inside the interface. Sometimes the most useful feature is a clean export rather than another chart. Sometimes the best interaction is providing enough context for the engineer to perform their own analysis.
And sometimes the best dashboard experience ends with the engineer opening another tool.
That is not a failure of the product. That is independence by design.
What this means for NiriX SHM by Nirixense
This principle is also shaping how we think about NiriX SHM at Nirixense. The objective is not to create a closed environment in which every structural question has to be answered inside the dashboard. Instead, the platform should provide the right level of abstraction for each user while maintaining a clear path back to the underlying engineering evidence.
At the higher level, this means making the condition of the structure understandable without requiring every user to interpret raw measurements. At the engineering level, the system needs to preserve the relationships that give those measurements meaning: the connection between the asset, zone, node, sensor, parameter, measurement and event.
The platform should therefore do what it is best suited to do organise information, establish context and make relevant evidence easier to find without turning that convenience into dependency. When deeper investigation is required, the engineer should be able to move from the interpretation back to the underlying data and continue the analysis using the tools appropriate to the question.
The platform can organise the evidence and make it easier to work with, but the evidence should remain useful beyond the platform itself.
Because the purpose of an engineering platform is ultimately not to keep the engineer inside the system. It is to give them enough context, access and control to make better use of it—and, when necessary, to confidently work beyond it.
© 2026 Nirixense Technologies Pvt. Ltd. All rights reserved. email: connect@nirixense.com
About this series: Field Notes in Structural Intelligence is a thought leadership series by Nirixense Technologies, where we engage with experts across structural engineering and monitoring to understand how SHM actually works in practice and where it needs to evolve next.