
The cost of crying wolf in SHM.
Divya Koppikar, Product and UI/UX Designer, Nirixense Technologies
Om Narayan Singh, Applications Engineer, Nirixense Technologies
(September 2026)
Structural Health Monitoring is fundamentally an exercise in interpreting change. Sensors continuously measure strain, acceleration, displacement, temperature, tilt, and other physical parameters, while software compares those measurements against an established baseline or expected operating range. When the measured behaviour departs from that expectation, the system generates an anomaly, warning, or threshold breach.
Detecting the deviation, however, is only the beginning of the engineering problem.
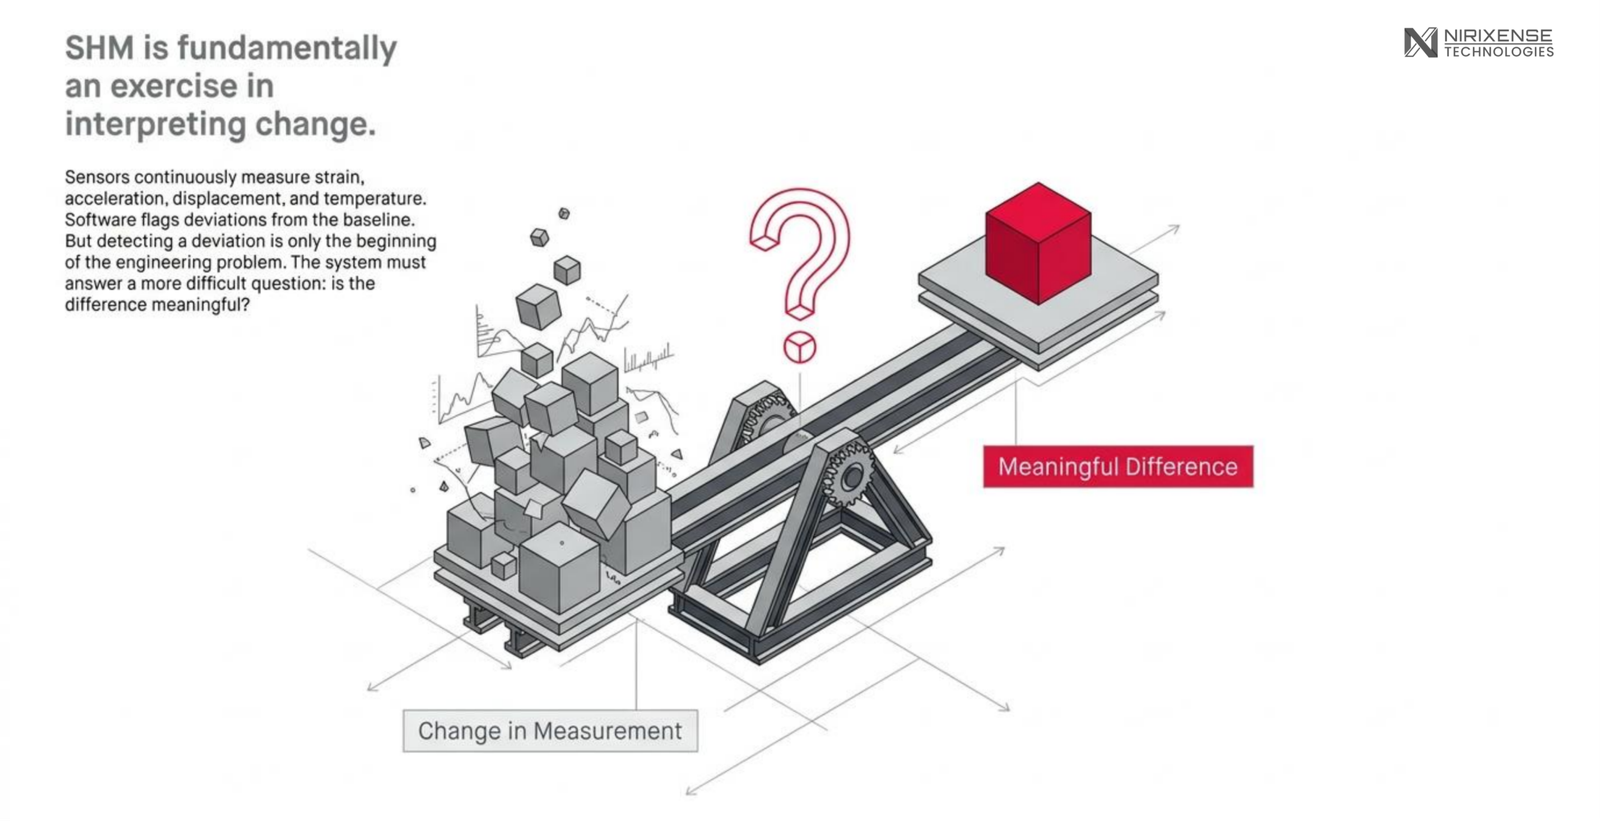
A measurement can change because the structure has changed, but it can also change because the temperature has changed, traffic loading has increased, the operating condition is different, the sensor has degraded, communication has been interrupted, or the system is observing a condition that was never adequately represented in the original baseline. The monitoring system therefore has to do more than identify that something is different. It has to help determine whether the difference is meaningful.
This distinction becomes increasingly important in continuous SHM. If every statistically unusual observation is presented to an engineer with the same level of urgency, the system may become more sensitive while becoming less useful operationally. The engineer is left to separate environmental variation, measurement artefacts, transient events, and genuine structural changes manually.
The cost of a false alarm is therefore not simply the time required to dismiss one. It is the gradual transfer of interpretation back to the engineer and the possibility that repeated low-value warnings make genuinely important events harder to recognise.
What if the change is actually normal?
Structures do not operate under controlled laboratory conditions. Their measured response is continuously influenced by temperature, humidity, traffic, wind, operational loading, boundary conditions, material behaviour, and interactions between these variables. Consequently, an SHM system that interprets deviation from a nominal value as evidence of deterioration can easily classify normal structural behaviour as abnormal.
The Z24 Bridge in Switzerland provides a well-established example. During approximately one year of monitoring, researchers observed substantial changes in the bridge’s dynamic characteristics under normal environmental conditions, particularly temperature. Environmental effects had to be characterised before artificially introduced damage could be distinguished reliably from normal behaviour. Subsequent work using the Z24 benchmark has similarly demonstrated that conventional damage-detection approaches can produce false positives when environmental variability is not adequately represented in the baseline model.
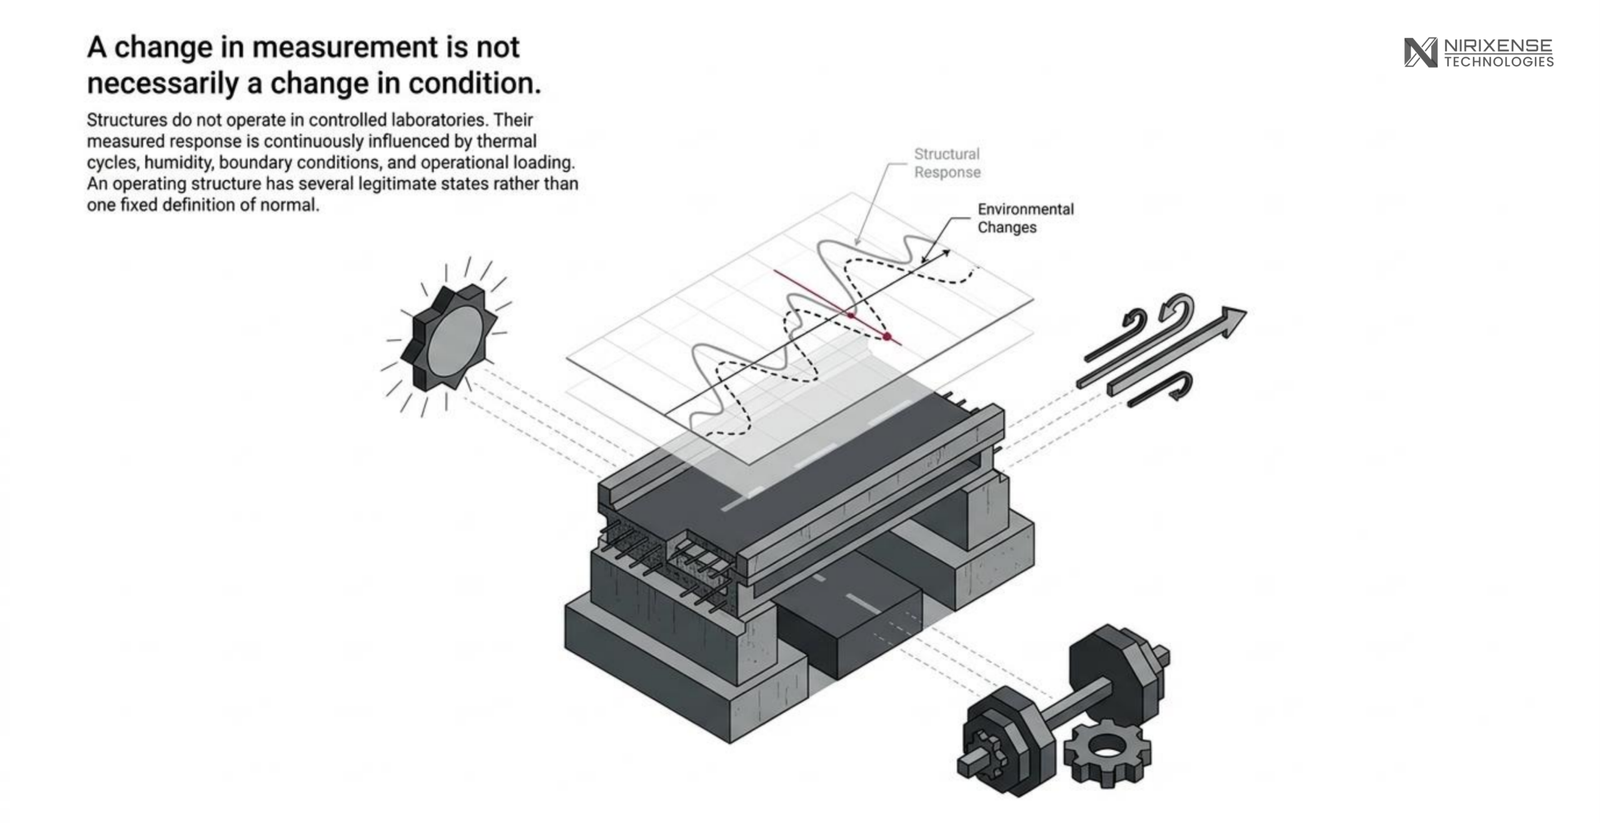
Long-term monitoring of the Tamar Bridge demonstrates the same principle from another perspective. Temperature, traffic loading, and wind were found to influence the measured structural response, reinforcing the fact that an operating structure may have several legitimate states rather than one fixed definition of “normal.”
The implication is fundamental:
A change in measurement is not necessarily a change in structural condition.
The relevant engineering question is therefore not simply whether a parameter has crossed a threshold, but whether the observed behaviour is inconsistent with what should reasonably be expected under the prevailing environmental and operational conditions.
But what does crossing a threshold actually tell us?
Thresholds are necessary because an SHM system needs a mechanism for converting continuous measurements into events that can be reviewed by engineers. But a threshold is an engineering boundary established for a particular monitoring objective; it is not a physical law separating safe behaviour from unsafe behaviour.
Research on the Hong Kong–Zhuhai–Macao Bridge immersed tunnel illustrates this problem. The study examined dynamic prediction and warning thresholds, noting that thresholds set too high can fail to identify abnormal behaviour, while thresholds set too low can produce excessive warning frequency and consume operational resources. The resulting approach used dynamic prediction and hierarchical warnings rather than treating every deviation as an equivalent structural event.
A threshold can therefore answer:
Has this measurement entered a region that warrants attention?
It cannot, by itself, answer:
Why did it happen? Is the measurement reliable? Is the deviation persistent? Is it spatially correlated? Is it explainable by the environment? What should the engineer do next?
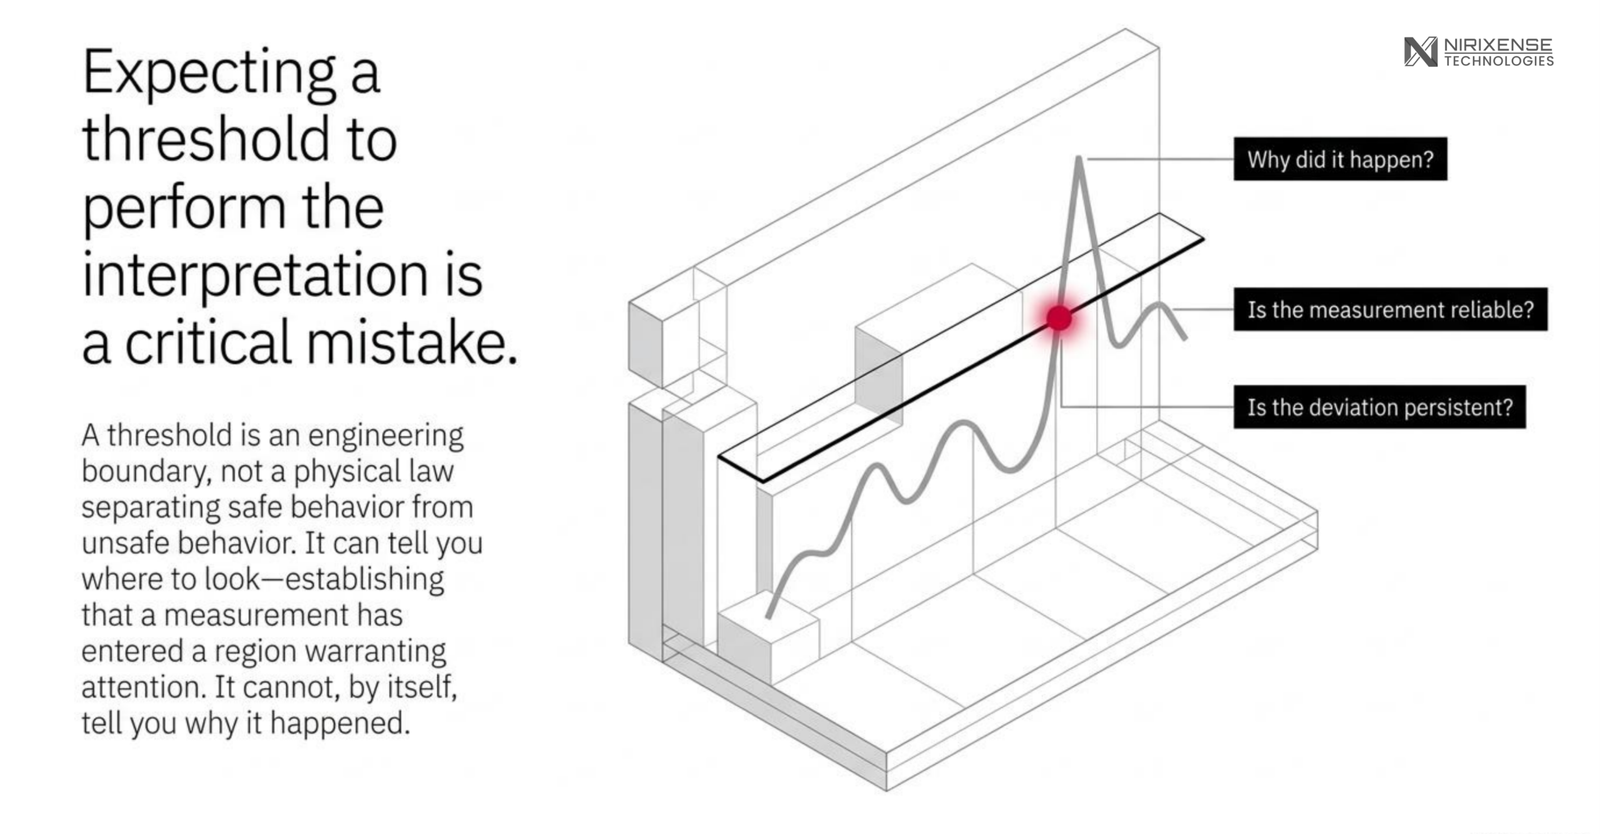
This is where threshold design becomes an engineering problem rather than simply a software configuration. The mistake is not using thresholds, it is expecting the threshold to perform the interpretation.
What if the structure isn’t actually the problem?
An SHM system does not observe a structure directly. It observes the structure through a measurement chain consisting of sensors, acquisition hardware, communications, timestamps, processing algorithms, and software.
A sudden strain excursion, for example, may represent a genuine structural response, but it may also originate from temporary data loss, sensor malfunction, communication interruption, acquisition errors, or software artefacts. A bridge monitoring study using strain data and high-fidelity finite-element analysis identified large strain excursions associated with temporary data outages and isolated hardware or software issues, requiring changes to the data-processing approach.
This introduces an important distinction between structural anomaly and measurement anomaly.
Before interpreting a deviation as evidence of structural behaviour, an SHM system should establish whether the measurement itself is sufficiently trustworthy. Was the signal continuous? Is the sensor healthy? Did neighbouring sensors respond similarly? Is the event persistent? Did a communication or acquisition fault occur at the same time?
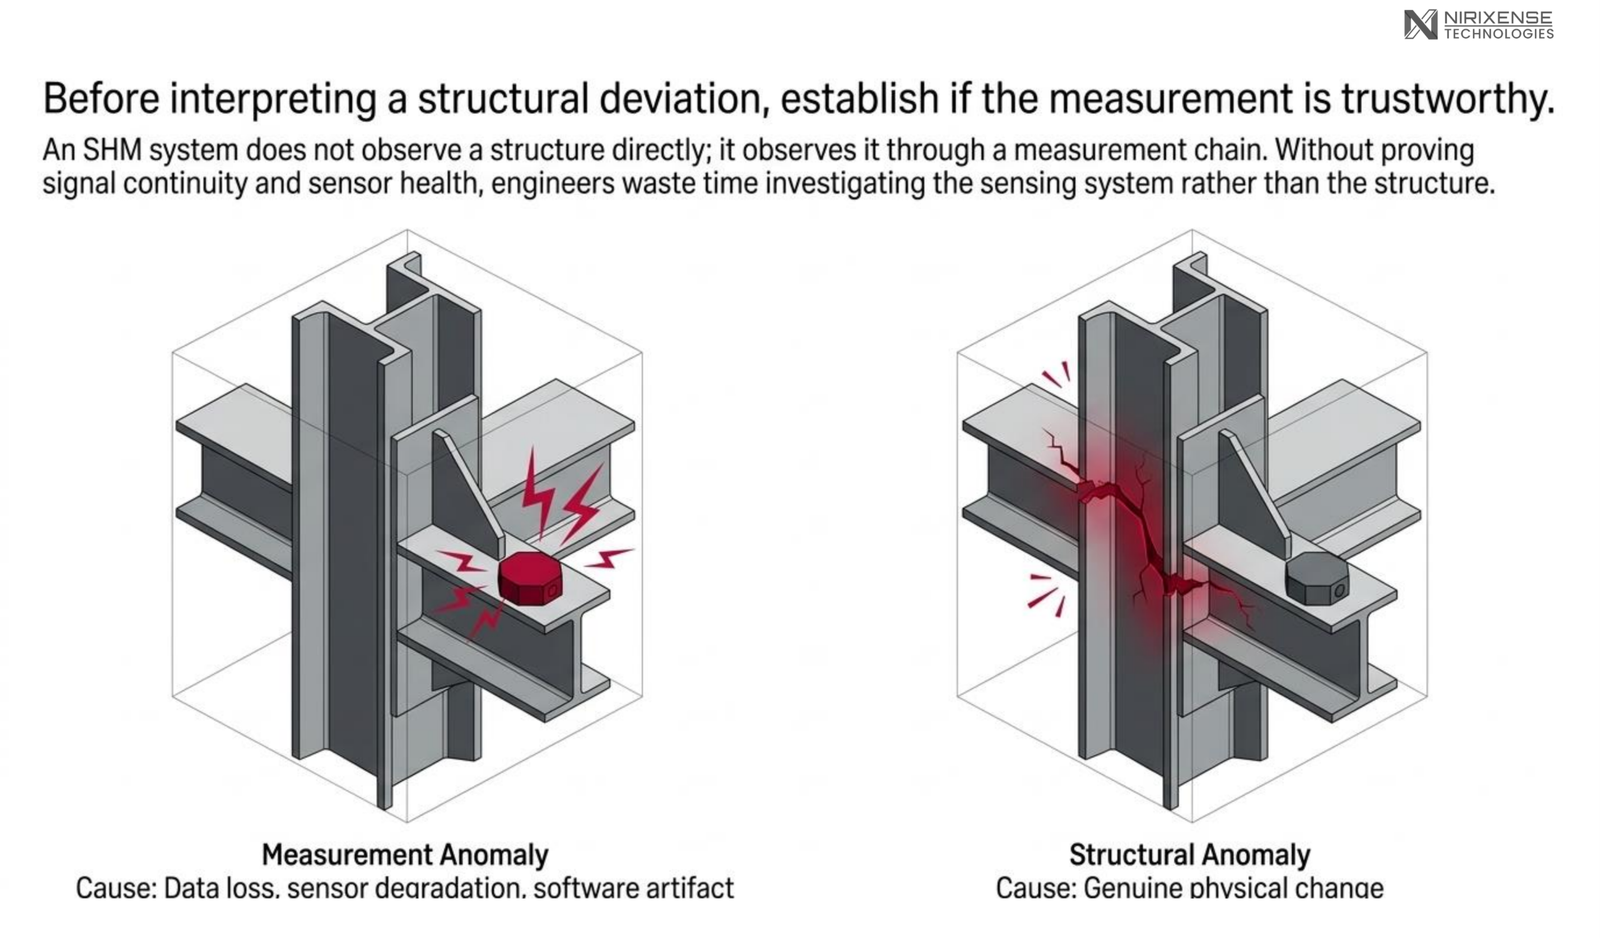
Measurement quality is therefore not merely a technical housekeeping layer beneath SHM. It is part of the evidence from which structural conclusions are made.
Without that distinction, the engineer can end up investigating the sensing system when the dashboard suggests that the structure itself requires attention.
What happens when the system starts generating too many events?
This becomes increasingly consequential as monitoring networks grow.
A large infrastructure asset may contain hundreds of sensors producing continuous measurements across multiple structural zones. Even if each sensor generates relatively few unusual observations, the aggregate number of events can become significant. The operational question consequently shifts from:
“Can the system detect anomalies?”
to:
“Can the system distinguish anomalies that require engineering attention from those that do not?”
The HZMB study illustrates this tension, noting that high warning frequency can create a mismatch between the number of detected events and the resources available to investigate them, particularly when anomalies may arise from environmental changes, sensor drift, unusual loading, or genuine structural behaviour.
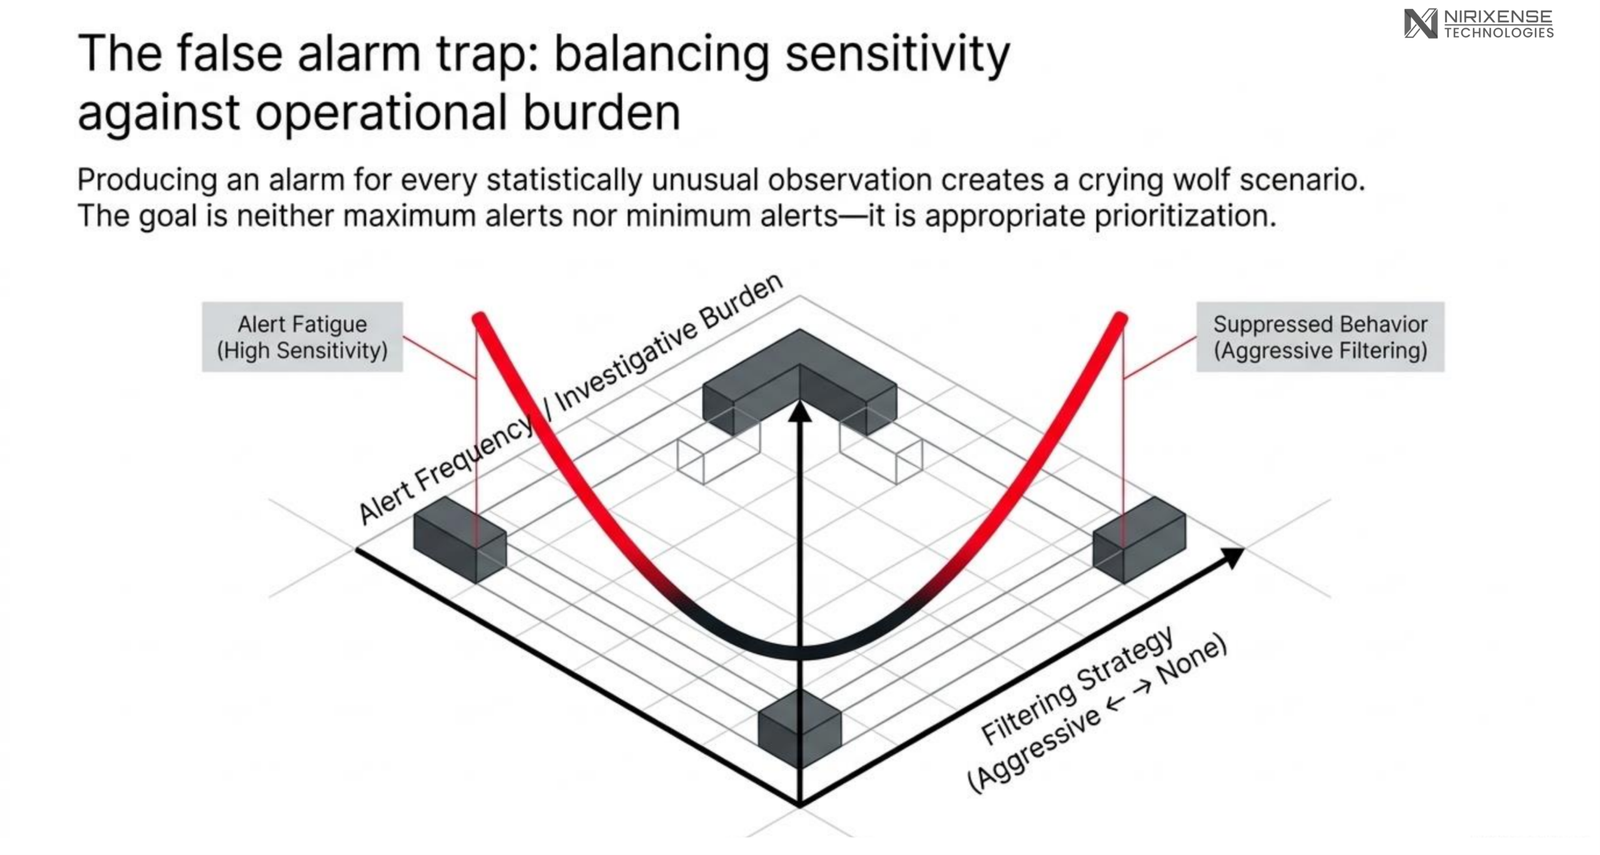
This creates a fundamental trade-off.
Increasing sensitivity can increase the probability of detecting a meaningful event, but it can also increase the number of events an engineer has to investigate. Aggressive filtering has the opposite problem: it can reduce the investigative burden while increasing the possibility that meaningful behaviour is suppressed.
The engineering objective is therefore neither maximum alerts nor minimum alerts.
It is appropriate prioritisation of engineering attention.
So how should an SHM system prioritise what matters?
A practical way to address this problem is to introduce a hierarchy of threshold breaches rather than treating every threshold crossing as an equivalent event.
At Nirixense, we structure threshold breaches across three levels: Alert, Alarm, and Action.
The purpose of these levels is not simply to provide three colours on a dashboard. They represent different degrees of engineering significance and, consequently, different levels of expected response.
An Alert indicates that something has changed sufficiently to warrant awareness or review. The condition may still be consistent with normal operating variability, but it has crossed a boundary at which the engineer should be able to see and contextualise it.
An Alarm indicates that the deviation warrants investigation. Its significance may come from magnitude, persistence, recurrence, corroboration from other measurements, or departure from an established operating envelope.
An Action condition represents a further escalation in which the available evidence has crossed a materially important boundary and may require intervention, escalation, or a defined engineering response.
The progression is therefore:
Detect → contextualise → prioritise → act.
Alert = Something has changed; Be aware and review context
Alarm = Something needs investigation; Investigate and establish cause
Action = Something may require intervention; Act, escalate, or initiate defined response
The numerical thresholds themselves must be established according to the asset, parameter, failure mechanism, baseline behaviour, design requirements, and monitoring objective.
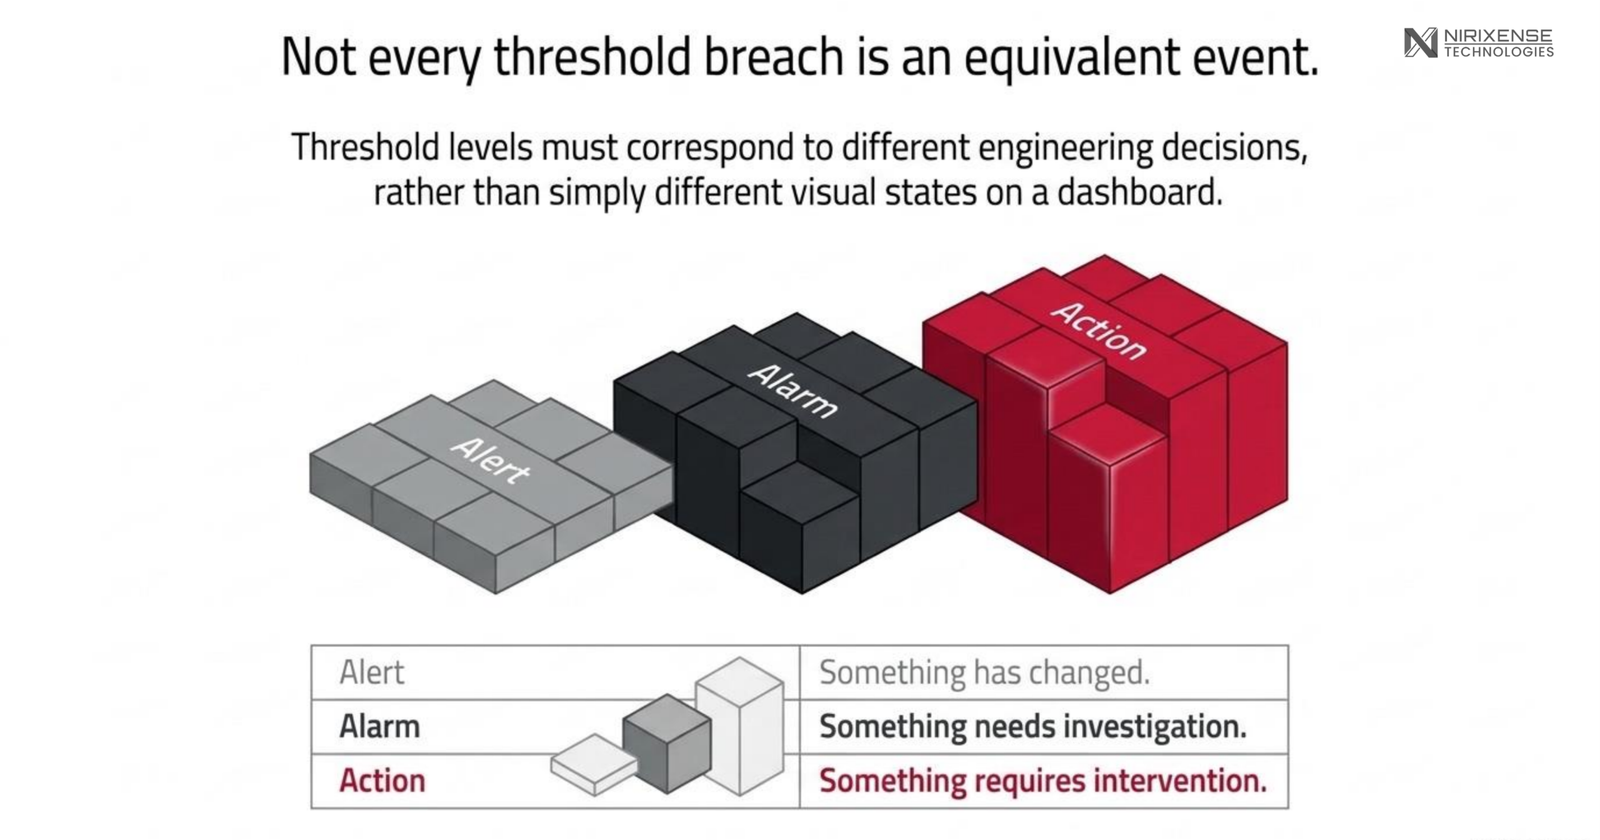
What matters is that the three levels correspond to different engineering decisions, rather than simply different visual states.
What should an engineer see when an alarm fires?
An alarm that only says “threshold exceeded” leaves much of the engineering work unfinished.
The engineer needs to understand the magnitude and duration of the deviation, its historical behaviour, relevant environmental and operational conditions, the status of the sensor, and whether related measurements support the observation.
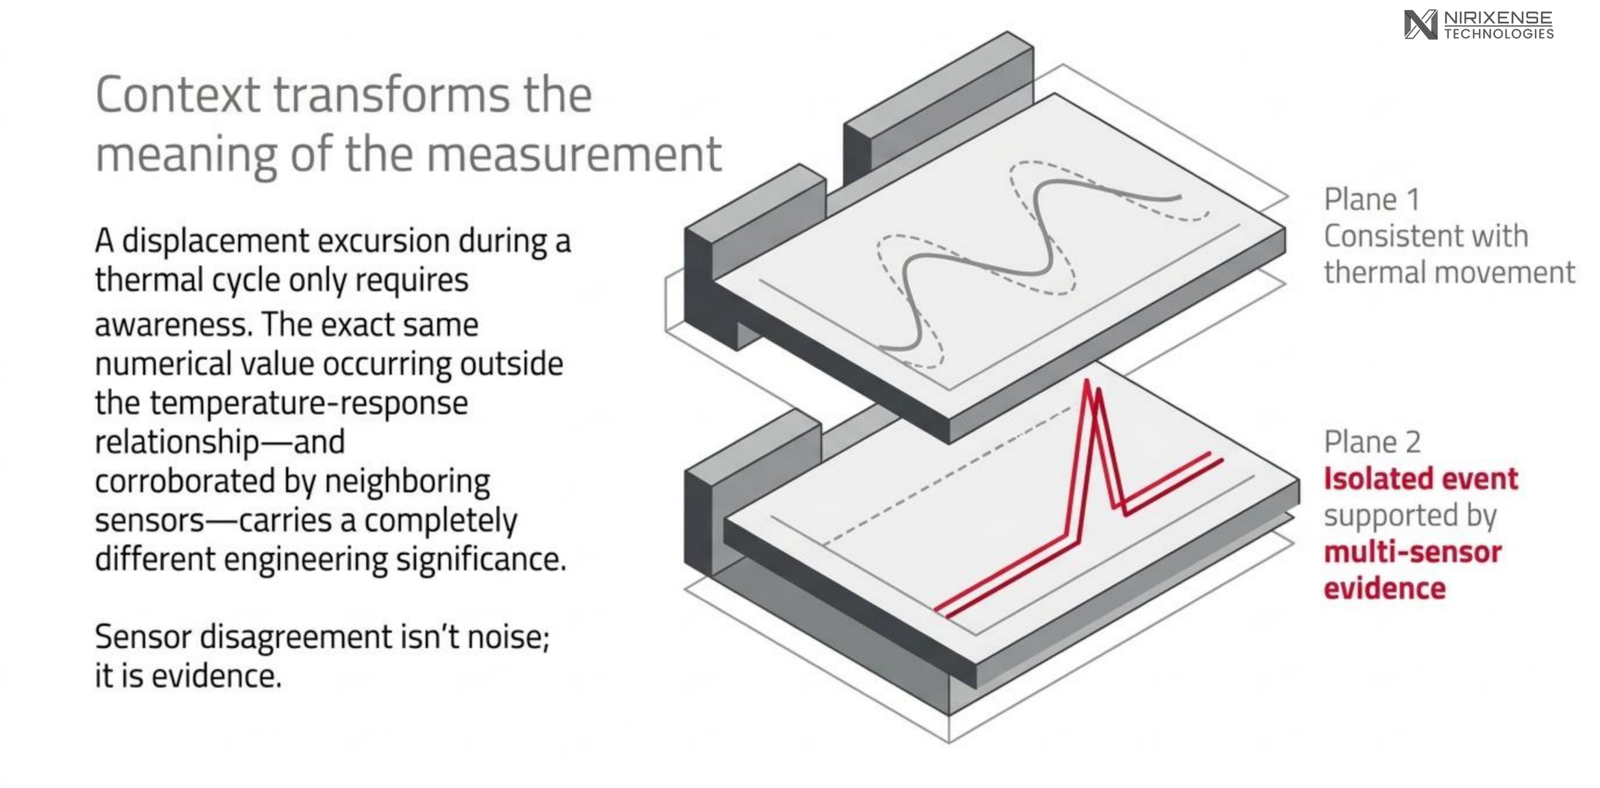
Consider displacement monitoring at a bridge bearing. A displacement excursion during a predictable temperature cycle may be consistent with thermal movement and therefore require only awareness. The same displacement, occurring outside the established temperature-response relationship and corroborated by neighbouring sensors, carries a substantially different engineering significance.
The numerical value has not become meaningful simply because it is larger.
Its context has changed the meaning of the measurement.
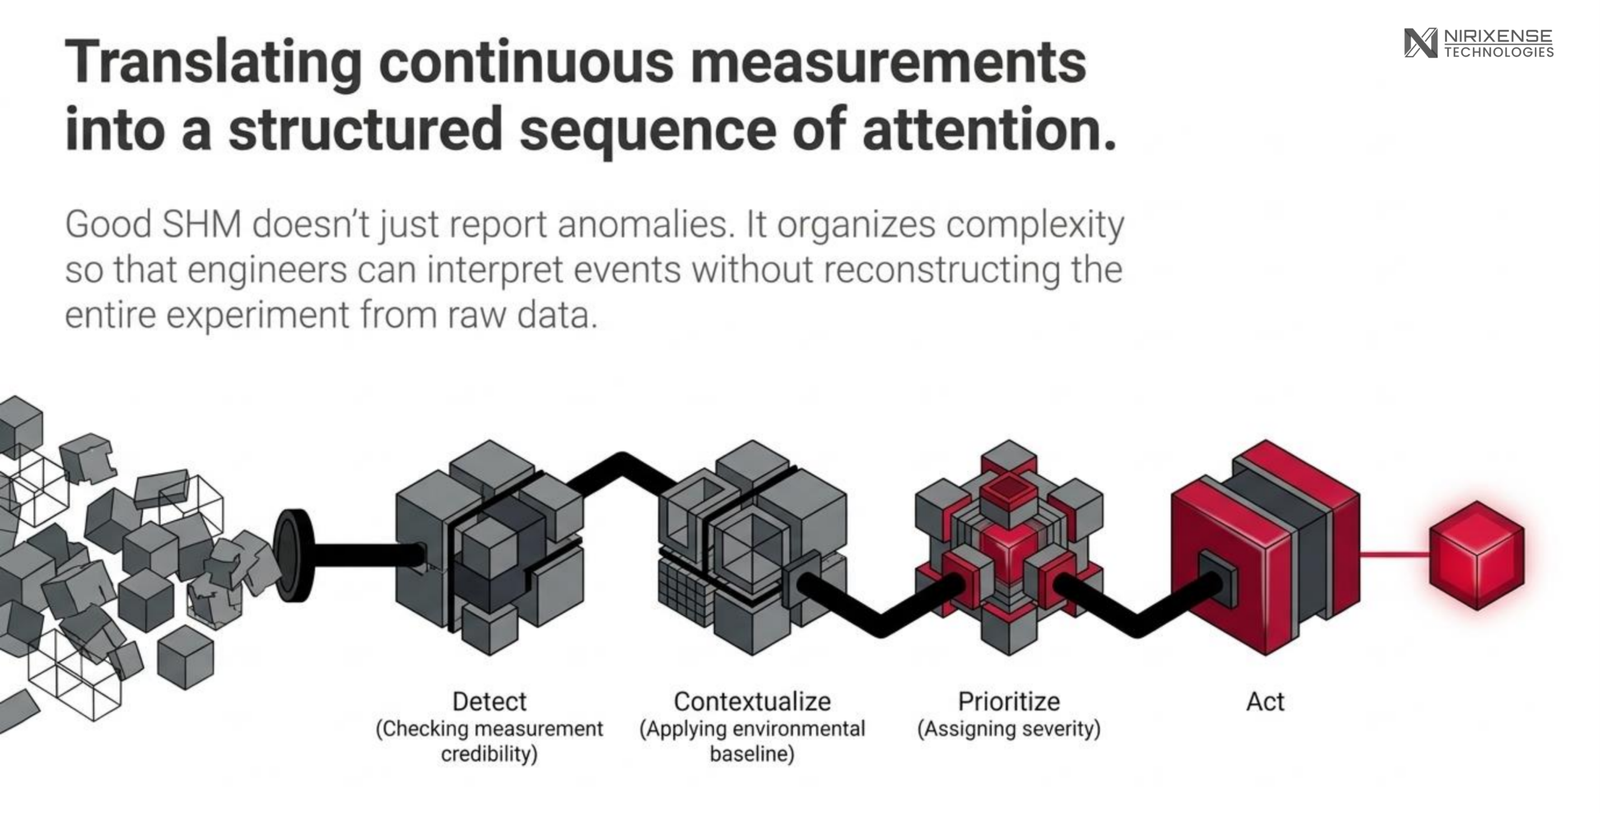
This is why an SHM platform should help an engineer establish whether an event is isolated or persistent, local or distributed, explainable or unexplained, and supported or contradicted by other measurements.
The objective is not to hide complexity from the engineer. It is to organise that complexity so that the engineer can interpret it without reconstructing the entire experiment from raw data.
And when two sensors disagree?
Sensor disagreement should not automatically be treated as noise or dismissed as a data-quality issue.
If two sensors expected to exhibit correlated behaviour diverge, several explanations are possible. One sensor may be malfunctioning; the structural response may be spatially heterogeneous; the assumed relationship may not hold under the current loading condition; or a local phenomenon may be occurring that is invisible to the second measurement.
In a multi-sensor SHM system, disagreement can therefore become evidence in itself.
The relevant question is not simply: “Which sensor is correct?”
It is: “What does the disagreement tell us about the structure or the measurement system?”
This is one reason multi-sensor correlation is important. A single time series can identify that something unusual happened. Relationships between sensors, environmental conditions, and operational states can provide evidence about why it happened.
Could trying to reduce false alarms create another problem?
False alarms represent one failure mode, but suppressing too many alarms creates the opposite problem.
Research on the I-40 bridge, for example, explored automated damage detection using Extreme Function Theory with an explicit focus on reducing false-positive errors while retaining sensitivity to deviations from normal behaviour.
The underlying challenge is therefore not simply to make an SHM system more sensitive. It is to balance two competing risks: missing a meaningful event and overwhelming the engineer with events that do not require action.
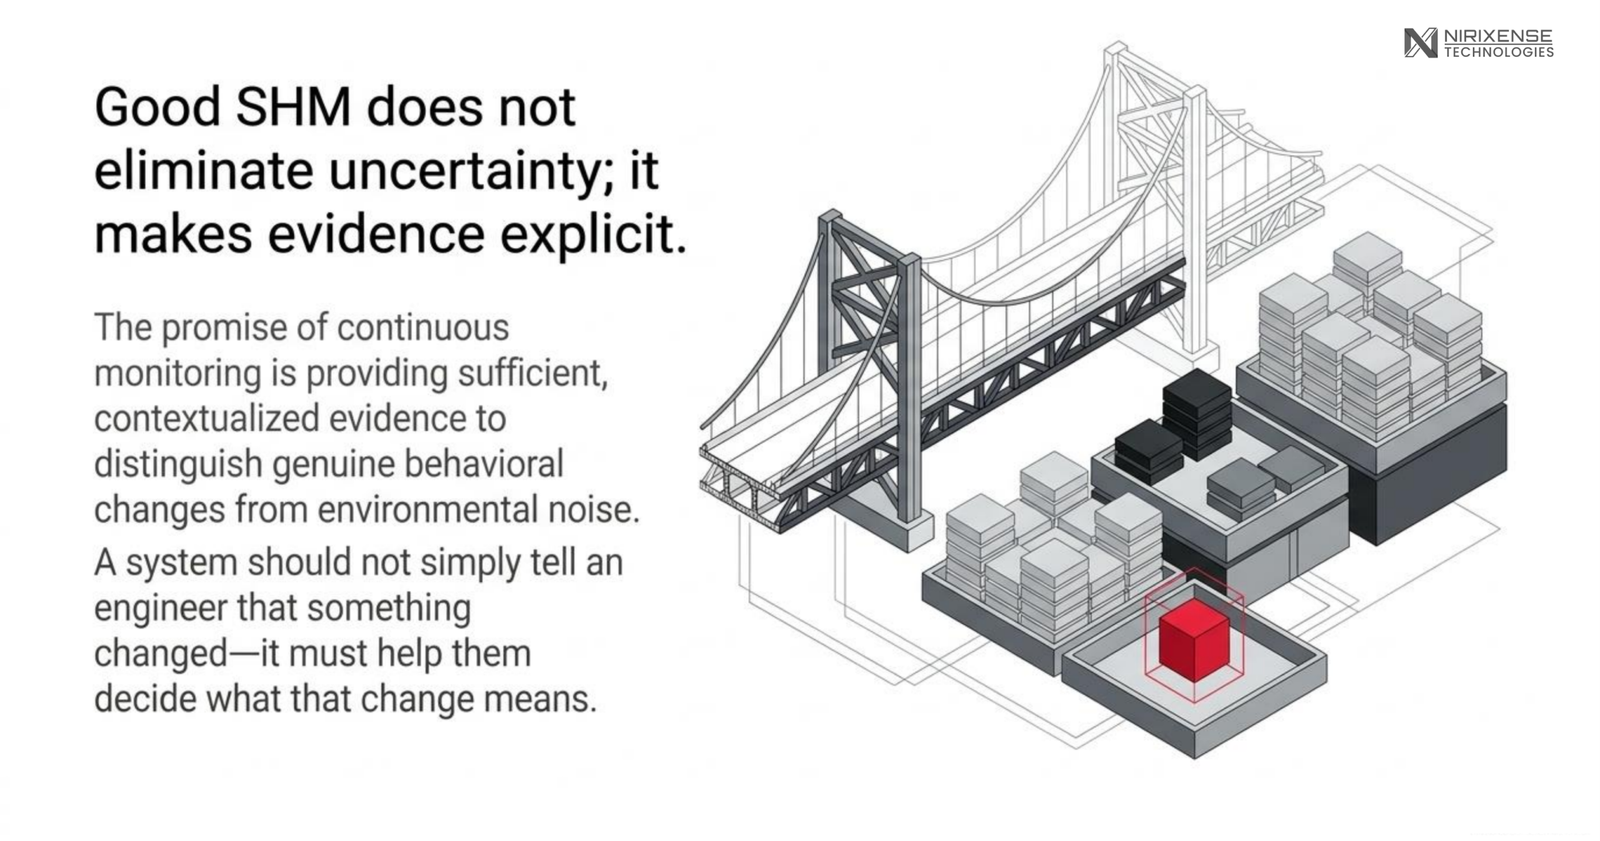
A system that produces an alarm for every statistically unusual observation may appear highly responsive but can place an unreasonable investigative burden on the engineering team. A system that suppresses unusual behaviour too aggressively may appear operationally efficient while reducing the probability that a meaningful change reaches the engineer.
Good SHM sits between these two extremes, it does not eliminate uncertainty but makes uncertainty, evidence, and escalation more explicit.
So what is the provider actually responsible for?
This is where the role of an SHM solution provider becomes more than instrumentation and data visualisation.
At Nirixense, the practical objective is to translate continuous sensor measurements into a structured sequence of engineering attention, so that an engineer is not required to interpret every deviation from raw data.
That begins at the measurement layer. The monitoring system has to establish whether the data itself is credible by tracking sensor health, communication continuity, missing data, and other measurement-quality conditions before a structural interpretation is made. A threshold breach without confidence in the underlying measurement should not automatically be treated as a structural event.
The next layer is contextualisation. Measurements need to be interpreted against the asset’s baseline behaviour and relevant environmental and operational conditions. A displacement excursion during a predictable thermal cycle should not carry the same significance as a persistent displacement that departs from the established response and is corroborated by neighbouring measurements.
Nirixense’s Alert → Alarm → Action framework provides the next step: prioritisation. Rather than presenting every threshold breach as an equivalent event, the system separates changes that require awareness from conditions that warrant investigation and conditions that may require escalation or intervention. This allows the monitoring system to allocate engineering attention according to the significance of the observed behaviour.
The practical contribution is therefore not simply that Nirixense can collect more measurements or generate more notifications. It is the ability to connect measurement quality, contextual evidence, threshold severity, and engineering response within the same monitoring workflow.
For an engineer, the intended sequence becomes straightforward:
The system detects a change → establishes whether the measurement can be trusted → provides relevant context → assigns an appropriate severity → and indicates the level of attention required.
That is the difference between a monitoring system that reports anomalies and one that helps engineers decide what those anomalies mean.
What should SHM ultimately optimise for?
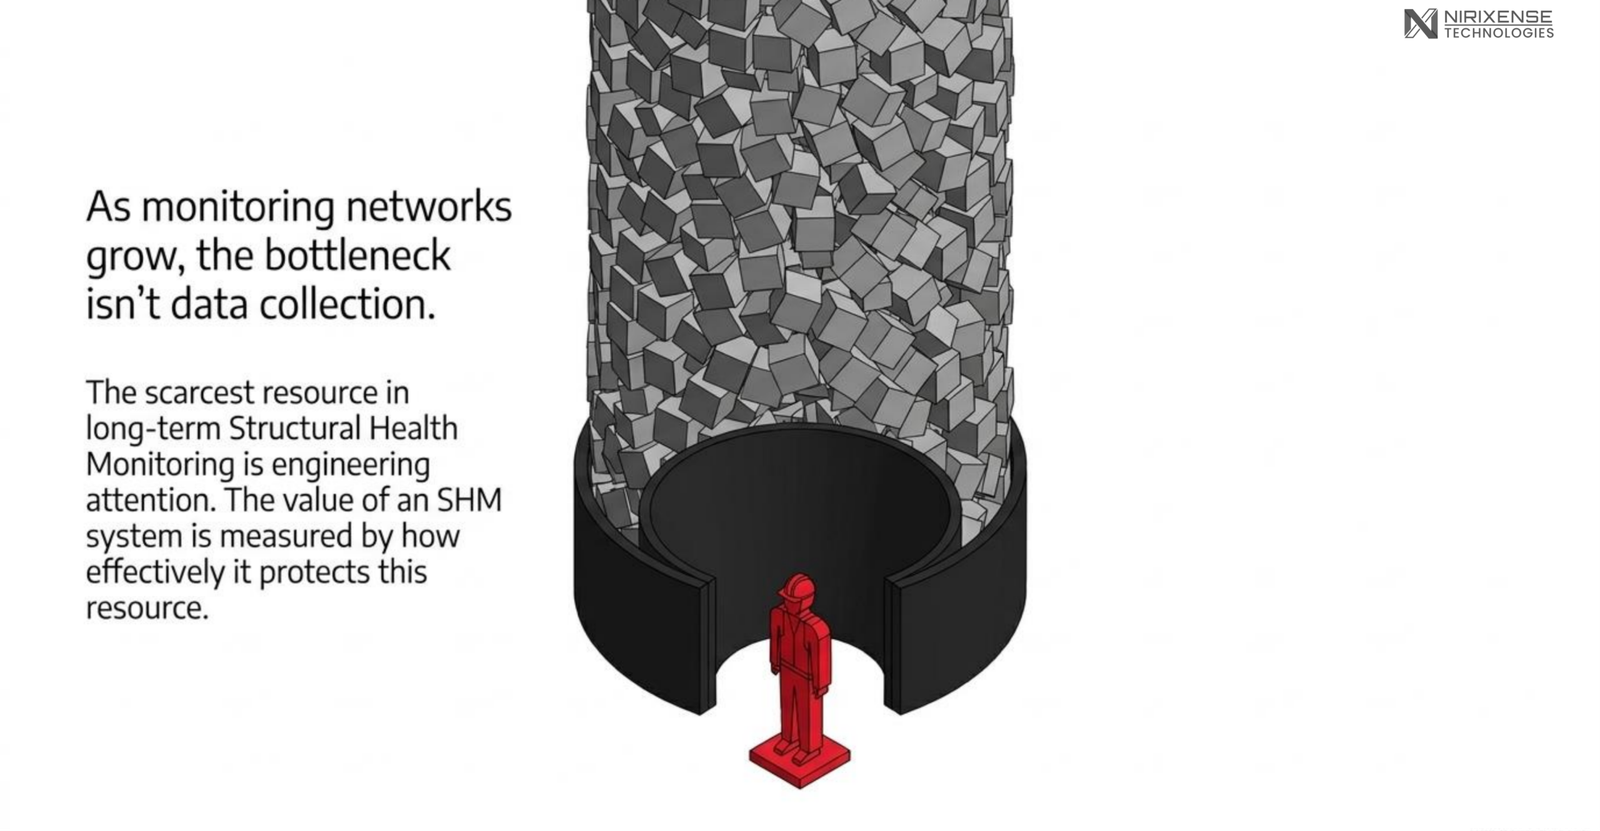
Not every deviation deserves the same response because the scarce resource in long-term SHM is not data, it is engineering attention.
The value of an SHM system is therefore not measured by how many anomalies it can surface, but by how effectively it helps an engineer distinguish the anomalies that deserve attention from those that do not.
© 2026 Nirixense Technologies Pvt. Ltd. All rights reserved. email: connect@nirixense.com
About this series: Field Notes in Structural Intelligence is a thought leadership series by Nirixense Technologies, where we engage with experts across structural engineering and monitoring to understand how SHM actually works in practice and where it needs to evolve next.